The CLEAN ENERGY PATENT GROWTH INDEX (CEPGI) is published quarterly by the CLEANTECH GROUP at Heslin Rothenberg Farley & Mesiti P.C. The CEPGI provides an indication of the trend of innovative activity in the Clean Energy sector from 2002 to the present. It also tracks success rates of earned patents by ranking Patent Owners, along with the Countries and the U.S. States which receive the most clean energy patents.
The granting of patents by the United States Patent and Trademark (PTO) is often cited as a measure of the inventive activity and evidence of the effectiveness of research & development investments. Patents are considered to be such an indicator, because to be awarded a patent, it requires not only the efforts of inventors to develop new and non-obvious innovations but also successful handling by patent counsel to shepherd a patent application through the PTO. Thus, the granting of a patent is an indicator that efforts at innovation have been successful and that an innovation had enough perceived value to justify the time and expense in procuring the patent.
The CEPGI (shown below annually) tracks the granting of U.S. patents for the following sub-components: Solar, Wind, Hybrid/electric vehicles, Fuel Cells, Hydroelectric, Tidal/wave, Geothermal, Biomass/biofuels and other clean renewable energy.
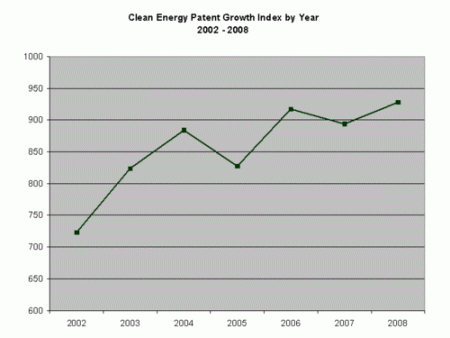 The CEPGI for 2008 was at its highest level in the seven year period of its tracking at 928 granted patents. As depicted in the below breakdown of the CEPGI by its sub-components, patents in wind, fuel cells, hydroelectric, tidal and geothermal were up in 2008 over 2007 with hydroelectric and tidal patents being at all time highs.
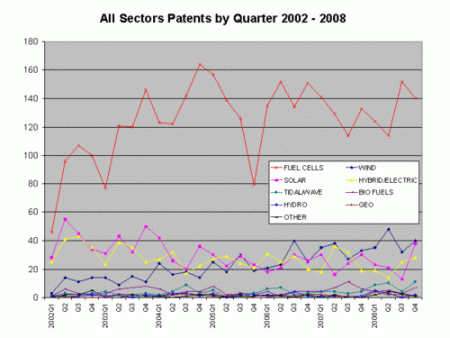
In contrast, solar patents decreased slightly in 2008 and continued at a relatively steady pace since 2005. Hybrid/electric vehicle and biomass/biofuel energy patents also fell in 2008. Wind patents increased dramatically in the last seven years from a low of 42 to a high in 2008 of 155. Fuel cell patents also continued to dwarf the other components of the CEPGI in absolute numbers in 2008.
The top patent owners since 2002 are shown below, also annotated to show the 2008 contribution:
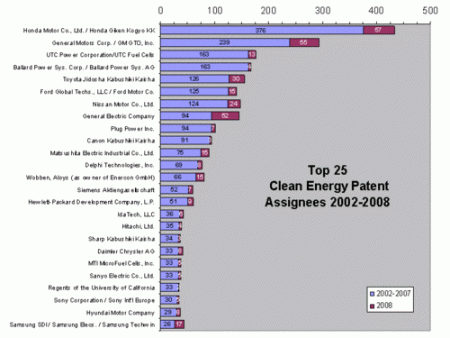
Honda again claimed the Clean Energy Patent crown in 2008 by edging General Motors out by two patents, and Honda leads overall since 2002. Automobile companies occupy 5 of the top ten patent leader spots since 2002 with three more in the top 25. Fuel Cell manufacturers Plug Power, Ballard and United technologies also appear in the top ten patent owners. The remaining spots in the top ten are occupied by General Electric on the strength primarily of its wind patents (with an assist from its solar technologies), and solar manufacturer Canon.
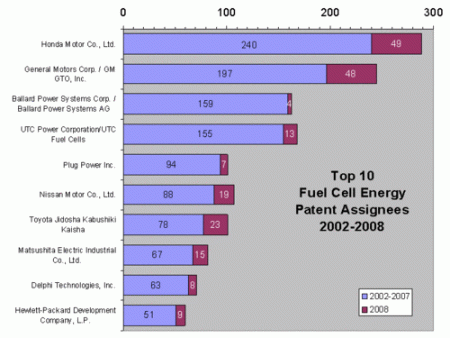
As depicted below in the Fuel Cell patent owner breakdown, Honda was also tops in Fuel Cells over the six year period, along with leading in 2008. GM, Nissan, Toyota and auto parts maker Delphi also cracked the top ten in fuel cells. Ballard and Plug Power remained in the top ten even with single digit patent totals for 2008. UTC, Matsushita and Hewlett-Packard round out the top ten for fuel cells.
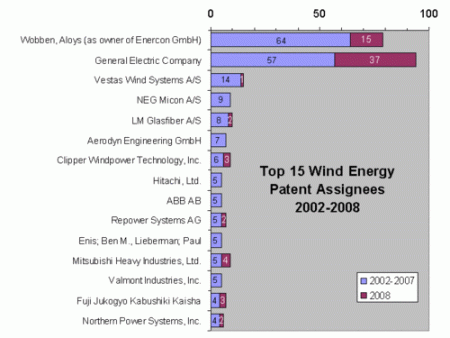
As indicated above, wind patents have increased dramatically in the last seven years, to a high in 2008 of 155. The vast majority of the activity in wind patents was driven by General Electric and Aloys Wobben, the owner of Enercon GmbH of Germany, as depicted above. GE claimed the top spot as the holder of the most wind patents since 2002 by adding 37 wind patents in 2008- making it tops in 2008 and overall. Vestas Wind Systems had 1 patent in 2008 and 15 overall. The rest of the top 15 were less than 10 overall and 1 or less for 2008.
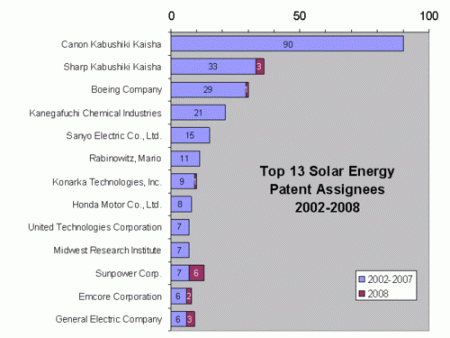
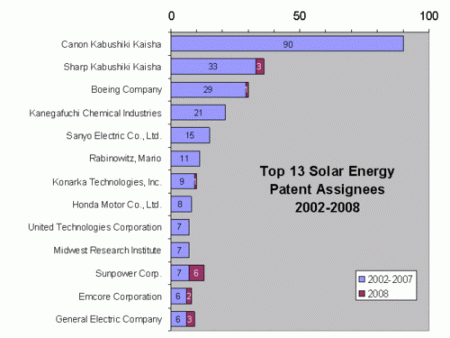
Canon continues to lead the other Solar patent owners since 2002 even without any patents granted in 2008 as depicted below. Sunpower Corp was the top patentee in 2008 with six granted patents and 13 overall. GE added to its wind patents in 2008 with 3 solar patents. Sharp added two patents and Emcore Corporation added 2 patents. Boeing and Konarka added one patent and the remainder of the top 11 patent owners since 2002 did not have any granted patents in 2008.
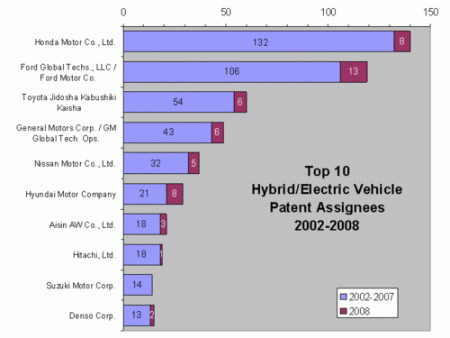
Honda and Ford lead Toyota, maker of the market leading Prius, in Hybrid/electric vehicle patents since 2002. GM’s work on the Chevy Volt has not yet been enough to propel in into the top 3 Hybrid/electric vehicle patent owners-leaving GM at number 4 since 2002. Ford led in 2008 with the only double digit (13) gain. Honda and Hyundai tied for second in 2008 followed by GM and Nissan. The rest of the top ten since 2002 includes Aisin AW Co. Ltd., Hitachi, Suzuki and Denso Corp.
Also, although not depicted above, Ocean Power Technologies continues to lead in the Tidal sector picking up 3 patents in 2008 and a total of 10 since 2002. Seabased AG picked up 2 patents in 2008 as did two individuals- Glen Cook and Dennis Hollis Gehring. GE also added one tidal patent and a hydroelectric patent. The other 2008 hydroelectric patentees each had one patent except for Simon Srybnik and Louis Srybnik who had two patents.
GE was granted two geothermal patents in 2008. Kalex, LLC continues to lead in geothermal patents despite no patents in 2008.
In the biofuel/biomass The Research Foundation of State University of New York continues to lead overall while each 2008 patentee had one patent each.
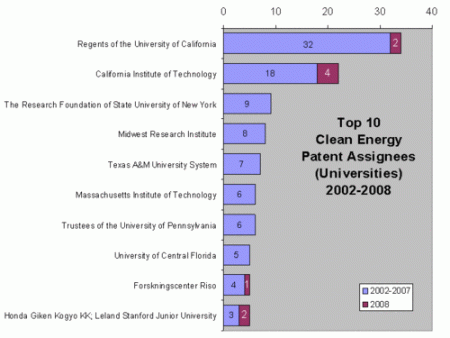
We have also looked at the top university patent owners and have found that the University of California is significantly ahead of second place California Institute of Technology in this all Golden State duel dating to 2002. The Research Foundation of the State of New York is a distant third and is grouped in descending one patent increments with Midwest Research Institute, Texas A&M, MIT, the University of Pennsylvania, Forskningscenter Riso of Denmark and Stanford Junior University (working with Honda).
Geographically, U.S. patent owners and inventors tied the rest of the world in the number of U.S. patents granted in the Clean Energy field over the period 2002-2008 with fifty percent of the granted U.S. patents as depicted below. California, Michigan, New York and Connecticut lead the other U.S. states in the Clean Energy area with the first three garnering twenty five percent of the Clean Energy patents granted to U.S. assignees since 2002.
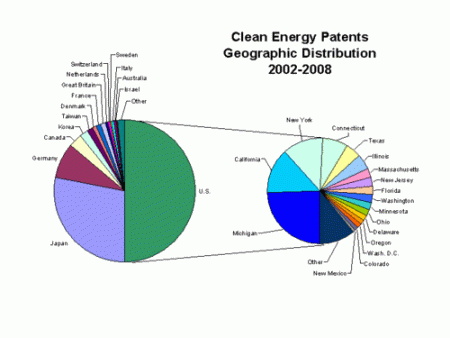
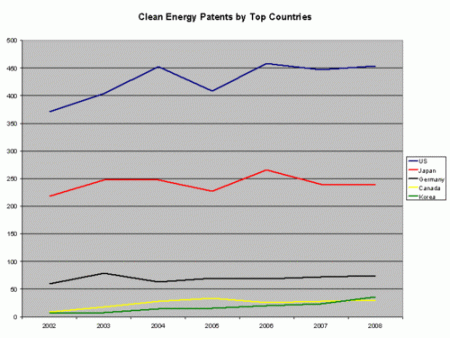
Patent applicants from Japan (29 percent) and Germany (8 percent) were issued the second and third largest number of U.S. patents. Canada and South Korea followed as depicted below with South Korea surpassing Canada in 2008.
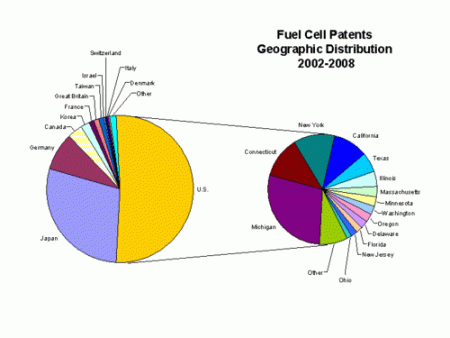
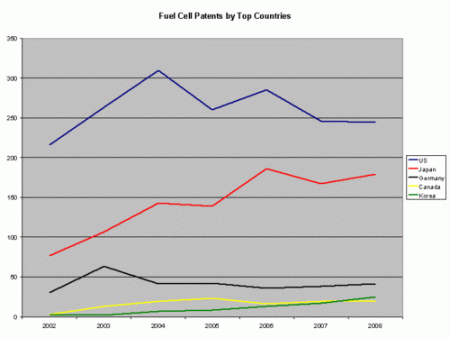
As depicted below, Fuel Cell patents since 2002 are dominated by Japan, Germany and the states of Michigan, Connecticut, New York, California and Texas. The U.S. leads the world with 52 percent of U.S. patents in fuel cells followed by Japan with 29 percent and Germany with 8 percent.
As depicted below, the number of patents granted to U.S. entities is trending downwardly since 2004 with the number granted to Japanese entities is on an upward trend.
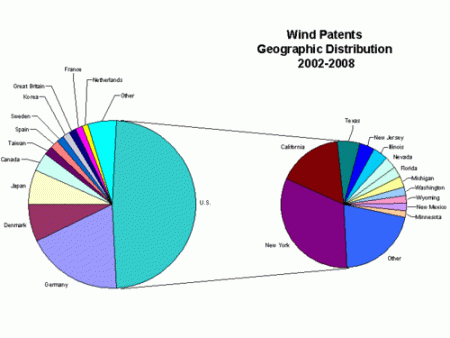
The U.S. is slightly behind the rest of the world in the number of U.S. wind patents granted since 2002 with 48 percent as depicted above. Germany follows with 19 percent due to Aloys Wobben, and Japan and Denmark tie for third at 7 percent. New York leads US states with 16 percent of the US wind patents thanks to GE. California follows with 8 percent and Texas lags at 3 percent.
As depicted below the number of patents granted to U.S. entities has been on a steep incline over the period illustrated while the rest of the world has stayed relatively consistent or is trending downwardly.

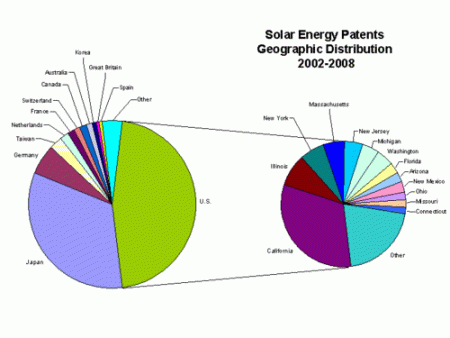
As in wind, the U.S. has slightly less than half the granted solar patents since 2002 at 46 percent as depicted below. Japan is next at 33 percent and Germany is at 6 percent. California leads U.S. States with fifteen percent followed by Illinois at 4 percent, and New York and Massachusetts at 3 percent. New Jersey Michigan and Washington are at 2 percent while Florida, Arizona, New Mexico, Ohio, Missouri and Connecticut are at one percent of the granted U.S. solar patents since 2002.
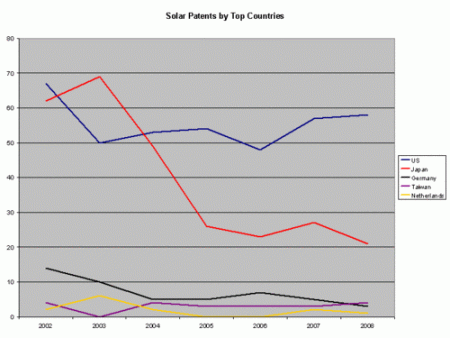
Also, as depicted below the number of solar patents granted to Japanese companies appears to be in a free fall while those granted to U.S. companies is at a relatively high level and on a slight upswing.
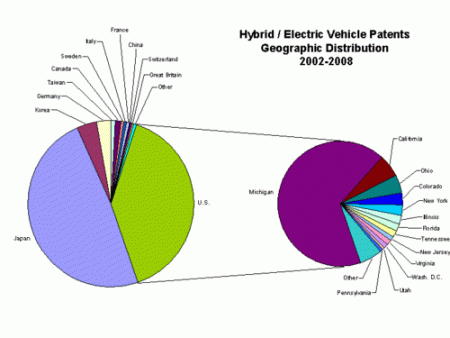
The U.S. has even less of the granted U.S. patents in Hybrid/ Electric vehicles than the sectors described above at 40 percent of the granted U.S. patents as depicted below. Japan leads, not surprisingly, with 48 percent of the granted U.S. patents in this sector. Korea has 4 percent while Germany has 3 percent. Michigan lead U.S. states with 27 percent of the granted U.S. patents in this area. California and Ohio have two percent while Colorado, New York, Illinois Florida, and Tennessee each have one percent.
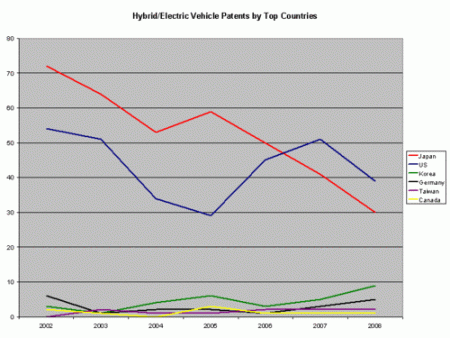
Hybrid/electric vehicle patents is on the decline both for Japanese and U.S. entities as depicted below.
We have also analyzed the relative concentration of patents among patent owners in each sector as presented in the first graph below with each concentric circle depicting the relative distribution of patents among the top one percent of patent owners, the 95-99 percentile, 80-95 percentile and the bottom eighty percent of patent owners. The second graph depicts the relative concentrations as a radiograph with the different shades of blue indicating the top 1 percent, top 1-5 percent, the next 15 percent and the bottom 80 percent of patent owners by number of patents received.
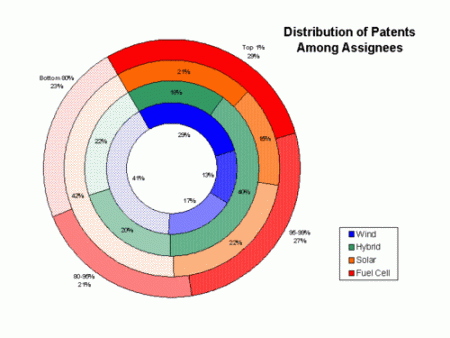
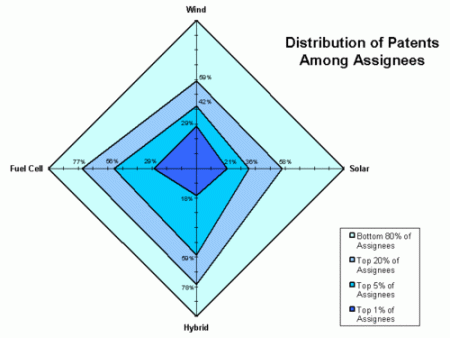
As depicted, Fuel Cell and Wind are the most concentrated in the top one percent of patent owners with 29 percent of the patents in each of these areas. Wind is the most stratified between the top (29%) the bottom (41%) having the lowest percentage (30) in the mid range of 1-80 percent of patent owners. In fact, seventy percent of wind patents are owned by the top one and bottom 80 percent of patent owners. Solar patents may be the most evenly distributed with twenty one percent of patents in the top one percent of patent owners, fifteen percent in the top 1-5 percent, twenty two percent in the next 15 percent and forty two percent of patents in the bottom 80 percent of patent owners. Hybrid/electric vehicle patents had the highest percentage in the top 2-5 percent range at forty percent of all hybrid/electric patents.
The CEPGI is updated quarterly and is occasionally supplemented with related articles posted on http://www.cleanenergypatentgrowthindex.com
Please contact us at info@cleanenergypatentgrowthindex.com if you have any questions or would like us to email you when we have updated this page or the CEPGI.
Authors: Heslin Rothenberg Farley & Mesiti P.C.
Etiquetas: clean energy, patent index
Deja un comentario